-buttons
on the left
of the amplitude spin boxes. Polarity can be reversed to negative up
with the +/--button below the
maximum amplitude spin box.
-buttons
on the left
of the amplitude spin boxes. Polarity can be reversed to negative up
with the +/--button below the
maximum amplitude spin box.
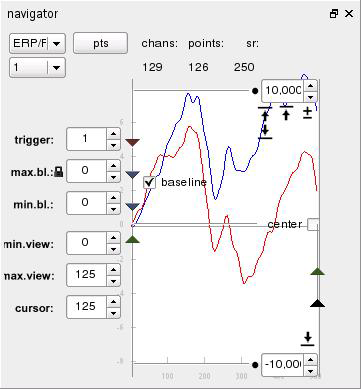
Timing, baseline and amplitude settings are configured using the
"navigator" docking window. Spinboxes on the top and bottom of the
navigator window allow you to set the maximum and mimimum ampltidue,
arrow symbols do automatic scaling of either minimum or maximum
amplitude or both values. Minimum and maximum amplitude values define
amplitudes of the bottom and top axes edge on the 2d graphs and
amlitudes associated with minimum and maximum colors on 3d graphs. When
the center checkbox
is activated, scaling adjustments are done symmetrically to zero.
Amplitudes can be rounded with the small circular -buttons
on the left
of the amplitude spin boxes. Polarity can be reversed to negative up
with the +/--button below the
maximum amplitude spin box.
Amplitude settings are remembered separately for 3 types of graphs:
standard ERP/F graphs, global power plots (GP) and zoomed sensors
(Zoom). You can select the currently active setting using the dropdown
box in the top left corner of the natvigator window.