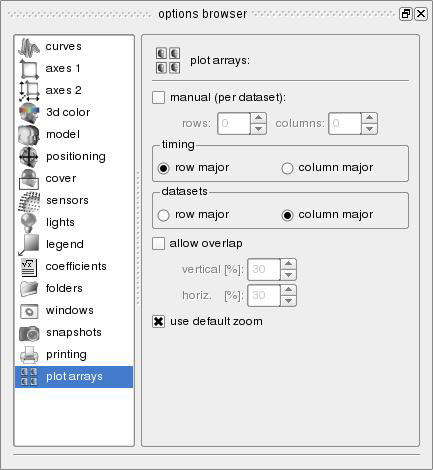

Using the plot array tab of the option browser dock widget, you can
modify the behavior of the generation of sequences of 3d graphs. By
default, the number of graphs to be generated are arranged
autoamtically to in columns and rows to fit a more or less square shape
with intervals arranged in row major order (first across columns, then
across rows) and datasets arranged in columns .
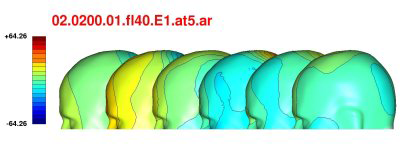
The allow overlap option can
be used to move the render models in the series close together or
create overlap effects as shown below:
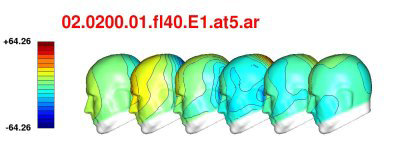
The use default zoom check
allows to disable the automatic centering of the render model in the
viewer and thus create custom views of the render model: