emegs for matlab
Created by: emegsadmin, Last modification: Tue 07 of Jul, 2020 (11:52 UTC)
EMEGS (ElectroMagnetic EncaphaloGraphy Software) for MATLAB was programmed to analyse data collected with high resolution EEG and MEG. The program runs under MAC, PC , Linux and Unix. It provides an elaborate graphical user interface, which allows for easy exploration of various types of visualizations and statistical analyses on ERP, ERF and wavelet data.
It is written in the MATLAB programming language and cannot run without the MATLAB environment (7 or higher). Moreover, for full functionality, it requires the 'Signal Processing Toolbox', 'Statistics Toolbox' and the 'Image processing toolbox'.
To download EMEGS for MATLAB register/login first.
For support in using EMEGS please refer to the email discussion list and the email archive at https://lists.sourceforge.net/lists/listinfo/emegs-user.
EMEGS for MATLAB was initially programmed in order to analyse data collected with an 128 sensor Electrical Geodesics EEG device, and a Bti 148 MEG system, therefore, these data formats are best supported. Support for the Neuroscan, CTF and BDF data format has recently been added.
This software is not a crash-safe! It was developed to allow for various types of data analysis, rather than to be crash-safe and selfexplicit. The documentation is short and incomplete. So be warned: there will be problems! You should be familiar with Matlab, or at the very least know somebody who is, to make good use of it. Moreover, there is no warranty whatsoever about the correctness of any results you obtain with EMEGS. We have successfully been using it for many years now, but there may be errors.
EMEGS for MATLAB is free software. You can redistribute it and/or modify it under the terms of the GNU General Public License as published by the Free Software Foundation (see licence page).
The current stable version of EMEGS for MATLAB is 3.1! The current beta version is 3.2!
EMEGS for MATLAB is fit to handle EEG and MEG data equally. It comprises batch functions to
- segment continuous data (trigger based)
- filter continuous data
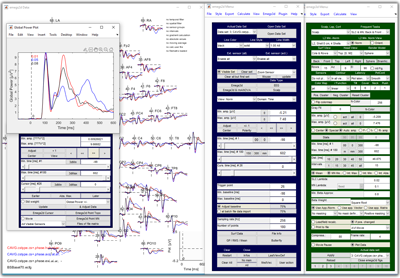
- statistically exclude artifacts (see picture)
- correct eye movement artifacts
- average across trials (and interpolate for missing sensors) (see picture)
- average across subjects
- calculate trial based activations (inverse minimum norm solution)
- in SPM image format (see picture) calculate evoked and induced frequency responses (wavelets)
It offers the following visualization modules :
- curve plotting (ERP, EMF)
- matrix plotting (Wavelet)
- single channel zoom
- global field power, root-mean-square, regional amplitude
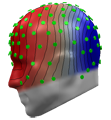
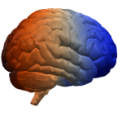
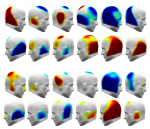
- data projection onto a 3d models (sphere, realistic or brain), using spherical spline interpolation (see picture)
- user defined coloring, amplitude scaling and intervals
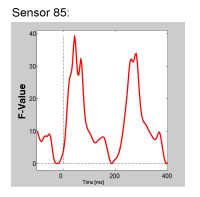
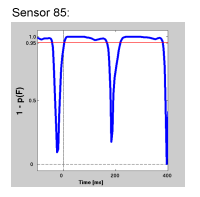
- statistical coloring of p-, F-, and t-values, including tools for masking
and allows to directly (sensor by sensor and sample by sample) perform a variety of analyses and statistical tests on EEG and MEG data:
- source localization (minimum norm)
- MEG sensor position standardization
- current source density
- fast fourier transformation
- principal component analysis
- t-test (paired and unpaired)
- repeated measures anova
- post-hoc contrasts
- permutation test
- cluster mass test (including sequential rejection)
It is written in the MATLAB programming language and cannot run without the MATLAB environment (7 or higher). Moreover, for full functionality, it requires the 'Signal Processing Toolbox', 'Statistics Toolbox' and the 'Image processing toolbox'.
To download EMEGS for MATLAB register/login first.
For support in using EMEGS please refer to the email discussion list and the email archive at https://lists.sourceforge.net/lists/listinfo/emegs-user.
EMEGS for MATLAB was initially programmed in order to analyse data collected with an 128 sensor Electrical Geodesics EEG device, and a Bti 148 MEG system, therefore, these data formats are best supported. Support for the Neuroscan, CTF and BDF data format has recently been added.
This software is not a crash-safe! It was developed to allow for various types of data analysis, rather than to be crash-safe and selfexplicit. The documentation is short and incomplete. So be warned: there will be problems! You should be familiar with Matlab, or at the very least know somebody who is, to make good use of it. Moreover, there is no warranty whatsoever about the correctness of any results you obtain with EMEGS. We have successfully been using it for many years now, but there may be errors.
EMEGS for MATLAB is free software. You can redistribute it and/or modify it under the terms of the GNU General Public License as published by the Free Software Foundation (see licence page).
The current stable version of EMEGS for MATLAB is 3.1! The current beta version is 3.2!
EMEGS for MATLAB is fit to handle EEG and MEG data equally. It comprises batch functions to
- segment continuous data (trigger based)
- filter continuous data
- statistically exclude artifacts (see picture)
- correct eye movement artifacts
- average across trials (and interpolate for missing sensors) (see picture)
- average across subjects
- calculate trial based activations (inverse minimum norm solution)
- in SPM image format (see picture) calculate evoked and induced frequency responses (wavelets)
It offers the following visualization modules :
- curve plotting (ERP, EMF)
- matrix plotting (Wavelet)
- single channel zoom
- global field power, root-mean-square, regional amplitude
- data projection onto a 3d models (sphere, realistic or brain), using spherical spline interpolation (see picture)
- user defined coloring, amplitude scaling and intervals
- statistical coloring of p-, F-, and t-values, including tools for masking
and allows to directly (sensor by sensor and sample by sample) perform a variety of analyses and statistical tests on EEG and MEG data:
- source localization (minimum norm)
- MEG sensor position standardization
- current source density
- fast fourier transformation
- principal component analysis
- t-test (paired and unpaired)
- repeated measures anova
- post-hoc contrasts
- permutation test
- cluster mass test (including sequential rejection)
 home
home