2d ERP/ERF display
- Data import
- Sensor configurations
- Amplitude scaling
- Baseline settings & timing
- Customizing 2d graphs
- Sensor groups
- Intervals
- Channel zoom
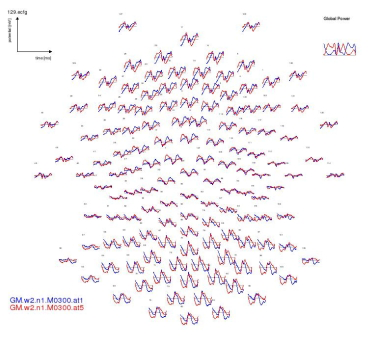
- Global Power
- Snapshots and printing
2d graphs are displayed in the central part of the emegs main window. Depending on the selected axes arrangement on the axes arrangement toolbar …

the layout of the sensor axes is either a planar projection of the spherical sensor coordinates (only available if a 3d sensor configuration is available) …
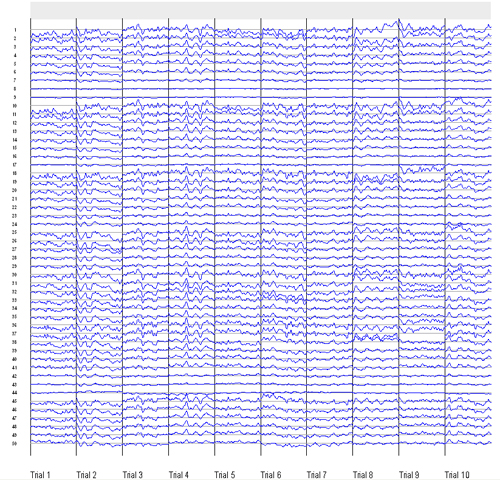
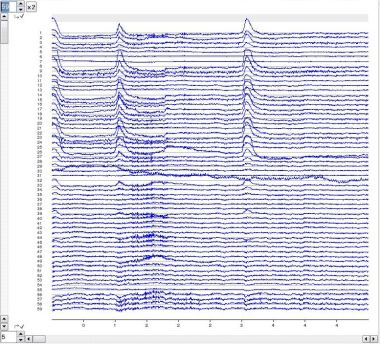
a vertical list ….
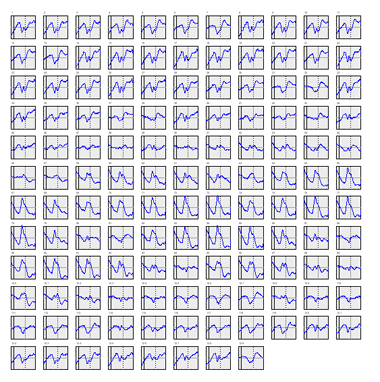
or a tiled arrangement….
Data formats containing data epochs such as Egis Session or SCADS App, when viewed as vertical list, are displayed as a series of epochs.